Calculates recursion information from the trajectory
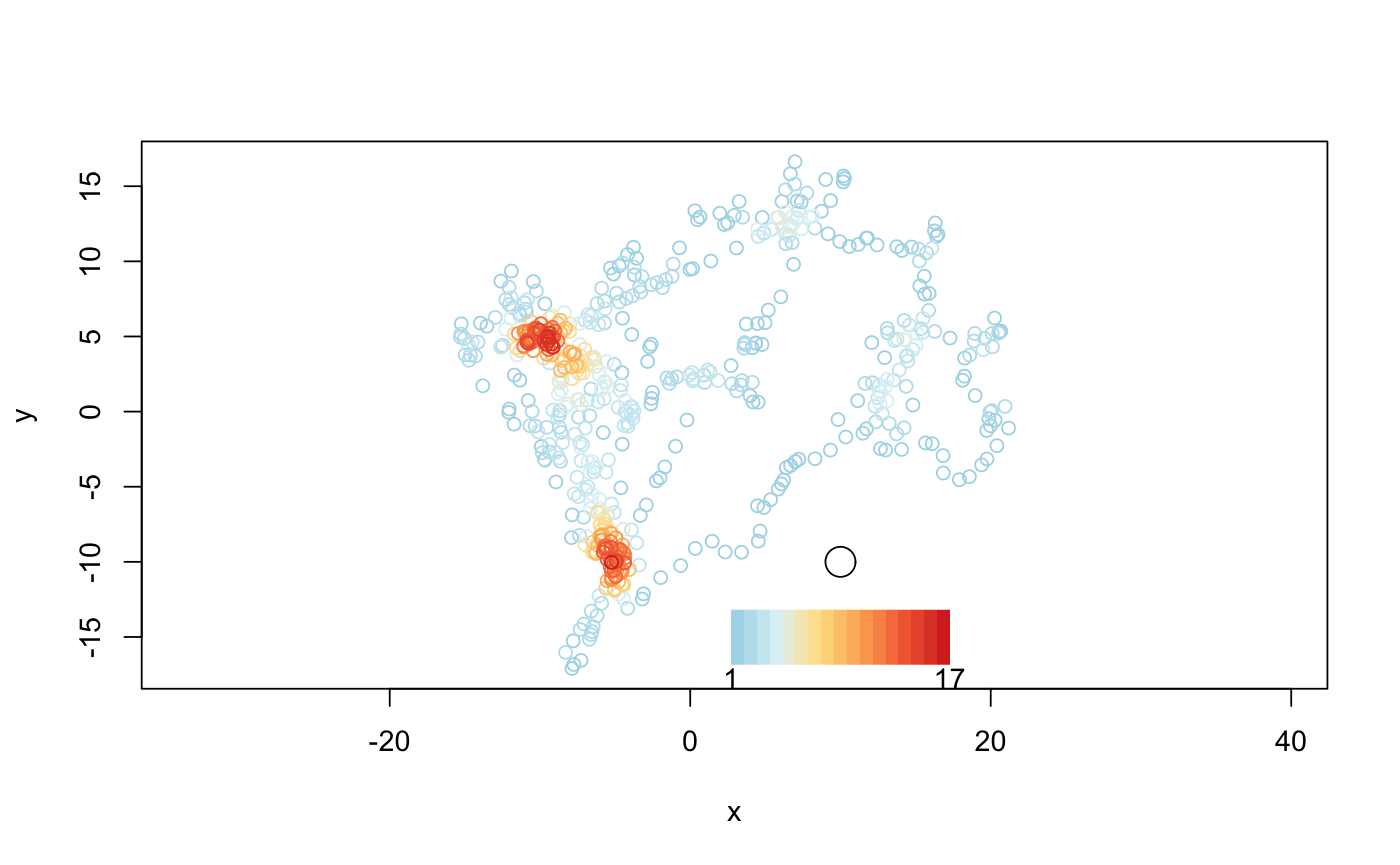
Plots a trajectory color coded by number of revisits to each point.
# S3 method for recurse
plot(x, xyt, ..., col, alpha = 1, legendPos = NULL)
Arguments
| x |
|
|---|---|
| xyt | data.frame of x, y, t, and id representing the xy-coordinates and the time (same as call to |
| ... | additional arguments to |
| col | optional vector of colors as long as the maximum number of revisits to color code trajectory points |
| alpha | optional alpha value for color transparency between 0 and 1 |
| legendPos | a vector of length 2 with the x and y coordinate of the center of the legend in user coordinates |
Value
the plot
Details
This method allows the user to visually represent the number of revisitations by location. The size
of the circle of radius R can be added to the plot with drawCircle.
See also
getRecursions, getRecursionsAtLocations, drawCircle
Examples
data(martin) revisits = getRecursions(martin, radius = 1) plot(revisits, martin, legendPos = c(10, -15))