Draws a circle
Draws a circle in data coordinates, so it will be a circle if the aspect ratio of the plot is 1, or else it will be appear as an ellipse.
drawCircle(x, y, radius, nv = 100, border = NULL, col = NA, lty = 1,
  lwd = 1)
Arguments
| x | x-coordinate of circle center |
|---|---|
| y | y-coordinate of circle center |
| radius | radius of circle |
| nv | how many plotted segments |
| border | polygon border |
| col | line color |
| lty | line type |
| lwd | line width |
Value
invisibly, the x and y points of the drawn circle
Details
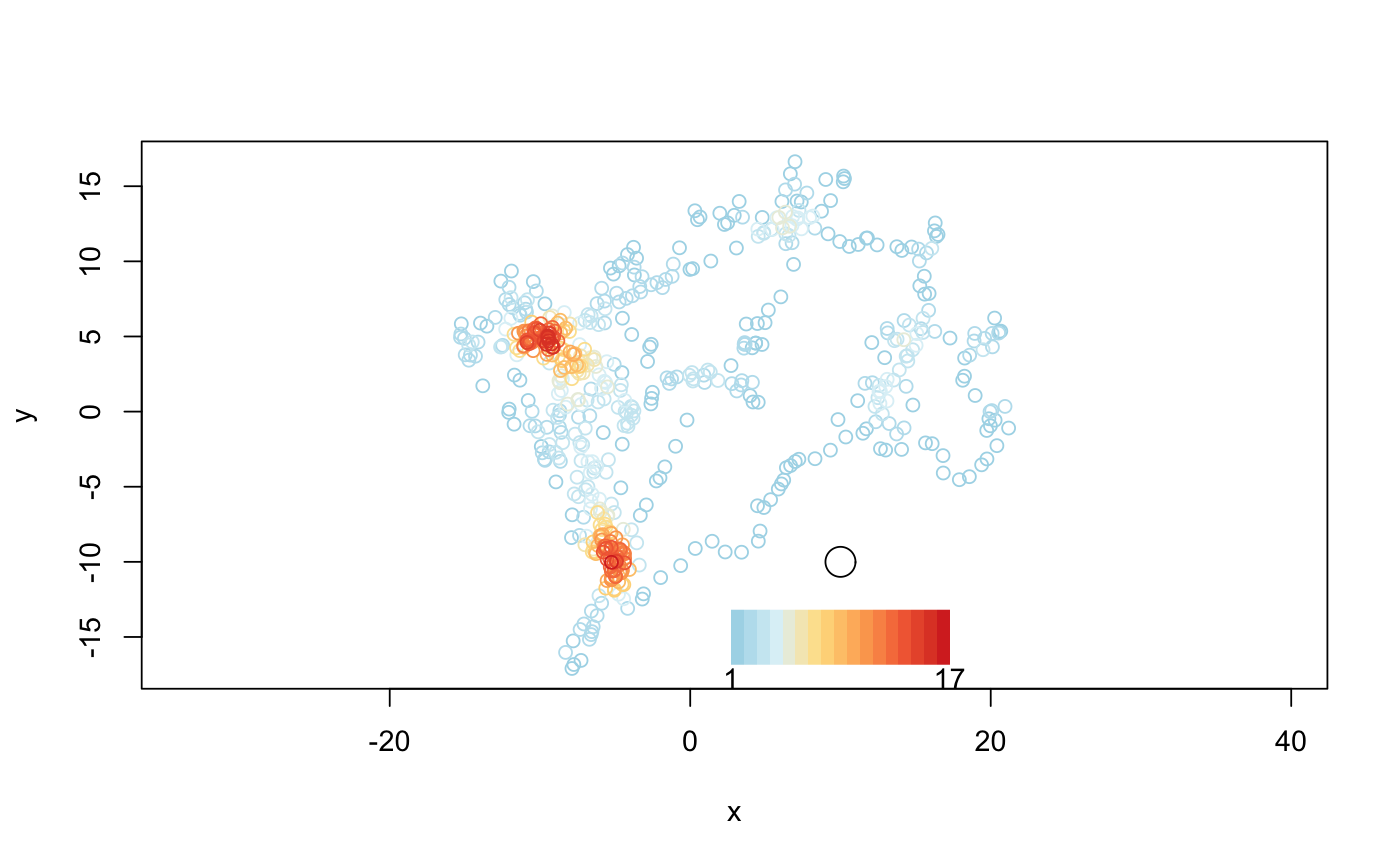
This function is useful to display a representative circle with the specified radius on a plot of revisits.
See also
Examples
data(martin)
revisits = getRecursions(martin, radius = 1)
plot(revisits, martin, legendPos = c(10, -15))drawCircle(10, -10, 1)